 kentaro.tools
Ranks Overall #7 Astro Showcase #2
Data from Nov 9, 2026, 6:53 PM UTC old Measured once a month · 1 run since Nov 9, 2026
Elsewhere:
PageSpeed Insights ·
Calibre ·
Treo ·
CrUX Vis ·
Tame the Bots ·
Scoring Calculator ·
Wayback Machine
Lab data is measured using Lighthouse, Mobile mode unless otherwise specified. Field data is reported from Chrome UX Report (using p75 measurements).
Stack
Lighthouse Scores LAB Simulated
Metrics LAB FIELD
Field figures are the p75 across real Chrome users over a 28-day trailing window (2026-09-27 → 2026-10-24), origin-level. From the backfilled CrUX history rather than this measurement, which predates the API key.
| Metric | Lab Simulated | Field | |||
|---|---|---|---|---|---|
| Value | Change / range | Trend | p75 | Distribution | |
| LCP CWV Largest Contentful Paint | 1.23 s good | — 1.23 s – 1.23 s | 1.34 s good | 91% 6.4% 2.5% | |
| INP CWV Interaction to Next Paint — field only, no lab run can measure it | n/a | — | — | — | |
| CLS CWV Cumulative Layout Shift | 0 good | — 0 – 0 | 0 good | 96.3% 2.5% 1.2% | |
| TBT Total Blocking Time | 0 ms good | — 0 ms – 0 ms | n/a | — | |
| FCP First Contentful Paint | 930 ms good | — 930 ms – 930 ms | — | — | |
| Speed Index | 930 ms good | — 930 ms – 930 ms | n/a | — | |
| TTFB Time to First Byte | 480 ms good | — 480 ms – 480 ms | — | — | |
LCP Subparts LAB Unthrottled
The subparts attribute LCP to your server, resource discovery, download, or rendering. Note that the Lab LCP shown above is a simulated throttled estimate.
Page weight
| Metric | Value | Change / range | Trend |
|---|---|---|---|
| Page Weight | 365 kB | — 365 kB – 365 kB | |
| Requests | 59 | — 59 – 59 | |
| Third-party Weight | 0 B | — 0 B – 0 B | |
| Third-party CPU | 0 ms | — 0 ms – 0 ms | |
| Unused JS | 0 B | — 0 B – 0 B | |
| Unused CSS | 0 B | — 0 B – 0 B |
By resource type
| Type | Transfer | Share | Size | Requests |
|---|---|---|---|---|
| image | 31.3% | 112 kB | 21 | |
| other | 25.8% | 92.2 kB | 13 | |
| font | 21% | 75.0 kB | 2 | |
| script | 17.5% | 62.5 kB | 20 | |
| stylesheet | 2.3% | 8.2 kB | 1 | |
| document | 2% | 7.3 kB | 1 | |
| Total | 365 kB | 59 |
Without JavaScript
The same load, photographed twice at 412×823: once with scripts disabled, once as rendered.
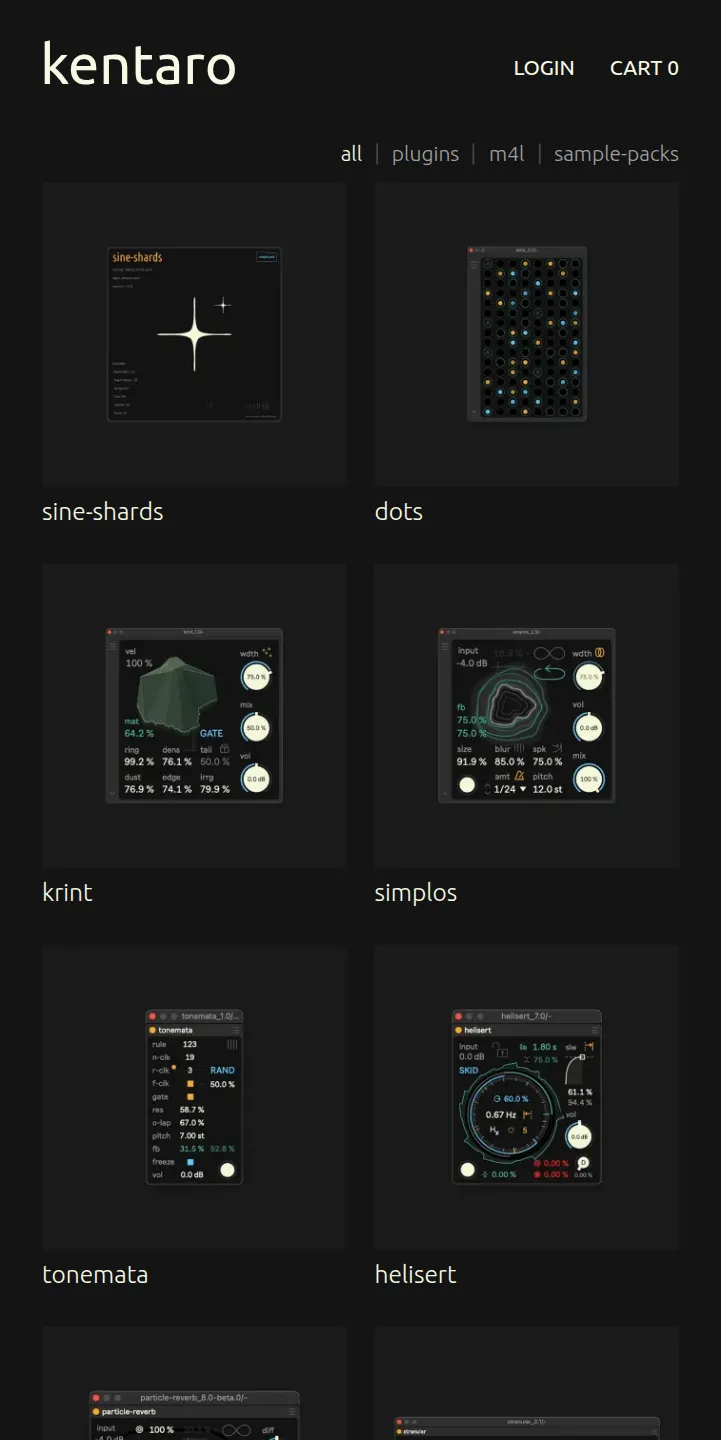
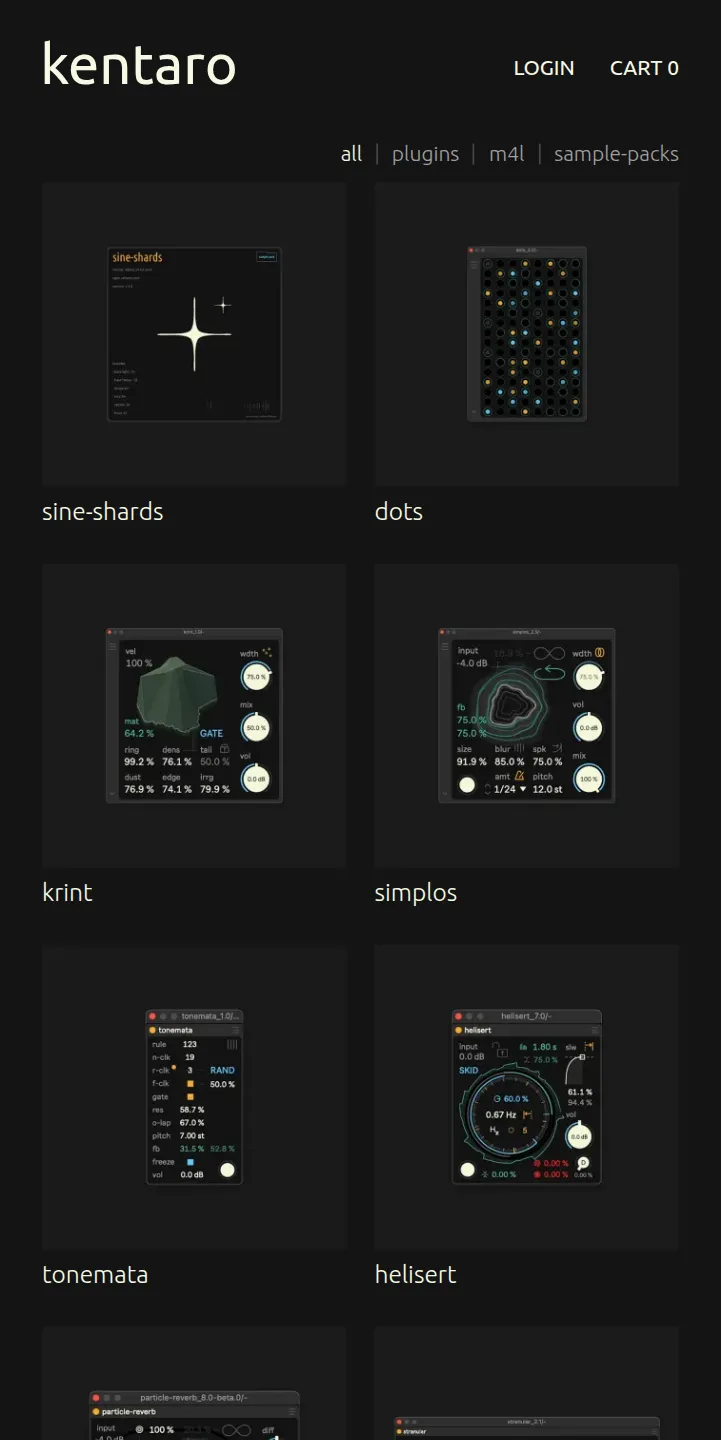
0% of pixels differ — they are identical. A shifted layout counts as difference, so a <noscript> banner alone can account for a large figure.
Page health
| Metric | Value | Change / range | Trend |
|---|---|---|---|
| Main Thread Work | 451 ms | — 451 ms – 451 ms | |
| Long Tasks | 0 | — 0 – 0 | |
| DOM Elements | 123 | — 123 – 123 | |
| Axe Violations Violating nodes from a full Axe CLI run (more than Lighthouse reports) | 0 | — 0 – 0 | |
| A11y Failures | 0 | — 0 – 0 | |
| A11y Failing Nodes | 0 | — 0 – 0 |
Main thread work
| Task | Time | Share | Duration Simulated |
|---|---|---|---|
| other | 57% | 257 ms | |
| script evaluation | 27% | 120 ms | |
| style layout | 6% | 28 ms | |
| parse HTML | 5% | 20 ms | |
| paint composite render | 4% | 18 ms | |
| script parse compile | 2% | 7 ms | |
| Total | 451 ms |
Axe violations axe-core 4.14.0, full rule set
0 violating nodes across 0 rules, 328 passing. This is a standalone Axe CLI run and is stricter than the subset Lighthouse already includes.
Hygiene
Measurement log
Field history 25 weeks
Weekly p75 from the CrUX History API, backfilled in a single request.
| Week ending | LCP | INP | CLS | FCP | TTFB |
|---|---|---|---|---|---|
| 2026-10-31 → 2026-11-07 | No data — 2 weeks under the CrUX reporting threshold | ||||
| 2026-10-24 | 1.34 s | — | 0 | 1.34 s | 523 ms |
| 2026-05-30 → 2026-10-17 | No data — 21 weeks under the CrUX reporting threshold | ||||
| 2026-05-23 | — | — | — | 1.02 s | — |
Runs
Every stored run for this URL, newest first.
| When | Scores | Perf | LCP | CLS | TBT | Weight | Runs | Spread | Bench | Lighthouse | Took | Archive |
|---|---|---|---|---|---|---|---|---|---|---|---|---|
| Nov 9, 2026, 6:53 PM UTC | 100 | 1.23 s | 0 | 0 ms | 365 kB | 3/3 | ±0 | 2,456 -1% | 13.6.0 | 24.2s |
|